

Your annual enrollment data isn’t just a file you send to carriers—it’s a treasure trove of insights about what your employees really want and need. Every choice they make tells a story: what matters most to them, where they might be confused, and what benefits truly resonate.
When you dig into those numbers, you can uncover patterns, spot gaps, and make smarter decisions that improve your benefits strategy. And here’s the best part, this isn’t just about data. It’s about using those insights to create a benefits experience that feels personal, relevant, and supportive.
Your employees’ elections hold valuable insights, but these often go unnoticed if you aren’t capturing and analyzing them. Are employees choosing plans based solely on cost, or are they prioritizing convenience and lifestyle compatibility? These patterns can reveal what your workforce truly values.
Every choice your employees make during enrollment tells a story. It’s up to you to make sense of what you read. Are they picking the cheapest plan because it fits their budget, or because they’re unsure about other options? Maybe convenience matters more than coverage. The patterns you find will reveal what’s most important to your workforce.
If you don’t analyze this wealth of data, you’ll miss opportunities to meet the real needs of your employees. So, start here:
As they say, the only consistent thing is change. Enrollment data is no different. Preferences shift as demographics change, and trends can signal bigger needs. For example, rising interest in telemedicine or mental health support might tell you that it’s time to modernize your offerings.
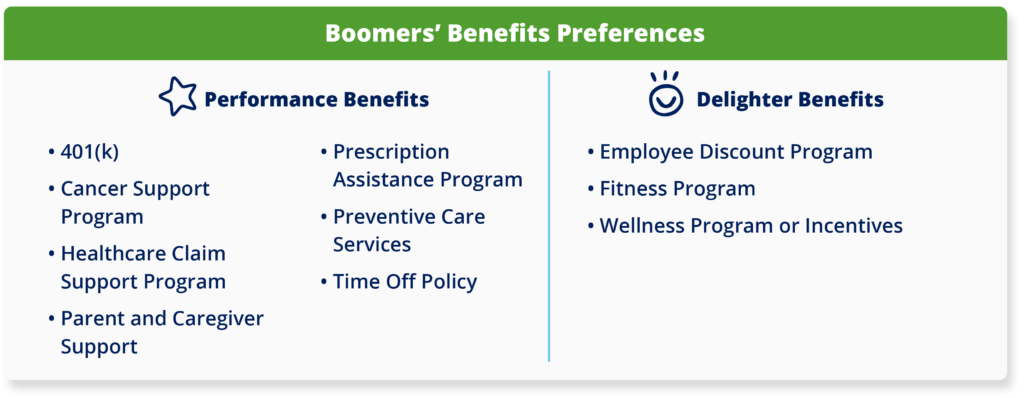
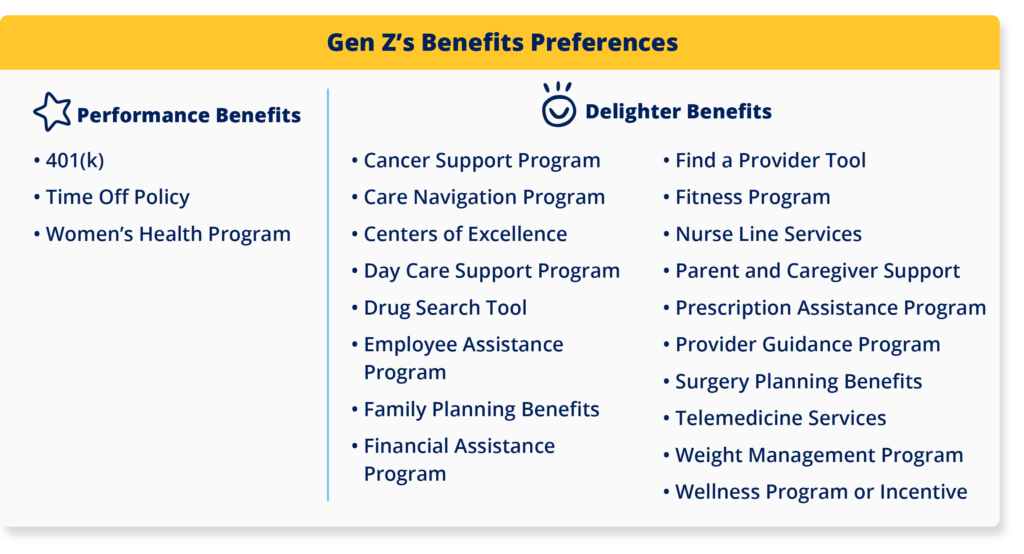
Below, you can see how benefit preferences differ between Gen Z and Baby Boomers. Baby Boomers were much more interested in Performance Benefits that directly increase employe satisfaction. While Gen Z focused more on Delighter Benefits that are unexpected, but that provide delight when present.
To unlock the value of your enrollment data:
The data will tell you what employees chose, but not why. Post-enrollment surveys can uncover motivations and barriers. That’s where feedback tools like member surveys come into play. We’ve mentioned how they’ll benefit your analysis, but what questions should you really be asking?
It might not be as complex as you think. To start, keep things simple by asking questions like:
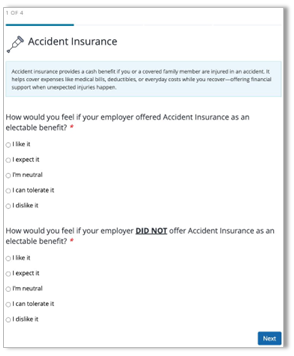
Want to dig in further? Consider deploying a Kano model survey to understand your people’s specific benefit preferences. A Kano model survey would measure which benefit programs are most important to an employee population. This will help you get feedback on specific benefits to help you understand what matters most.
Here’s an example of what it might look like:
Your data is only as valuable as how you use it. Once you’ve analyzed trends and gathered feedback, you can make educated changes to your benefits approach knowing that you put the work in. But what should you change? It might feel overwhelming.
Here’s a starting place:
Your annual enrollment data is more than numbers—it’s a roadmap to better benefits. Combine it with member feedback and you’ll have a great view of your population that will help you meet their current needs and anticipate future ones. In doing so, you’ll foster a workforce that feels heard and valued.