Businessolver

Benefits reporting and analytics

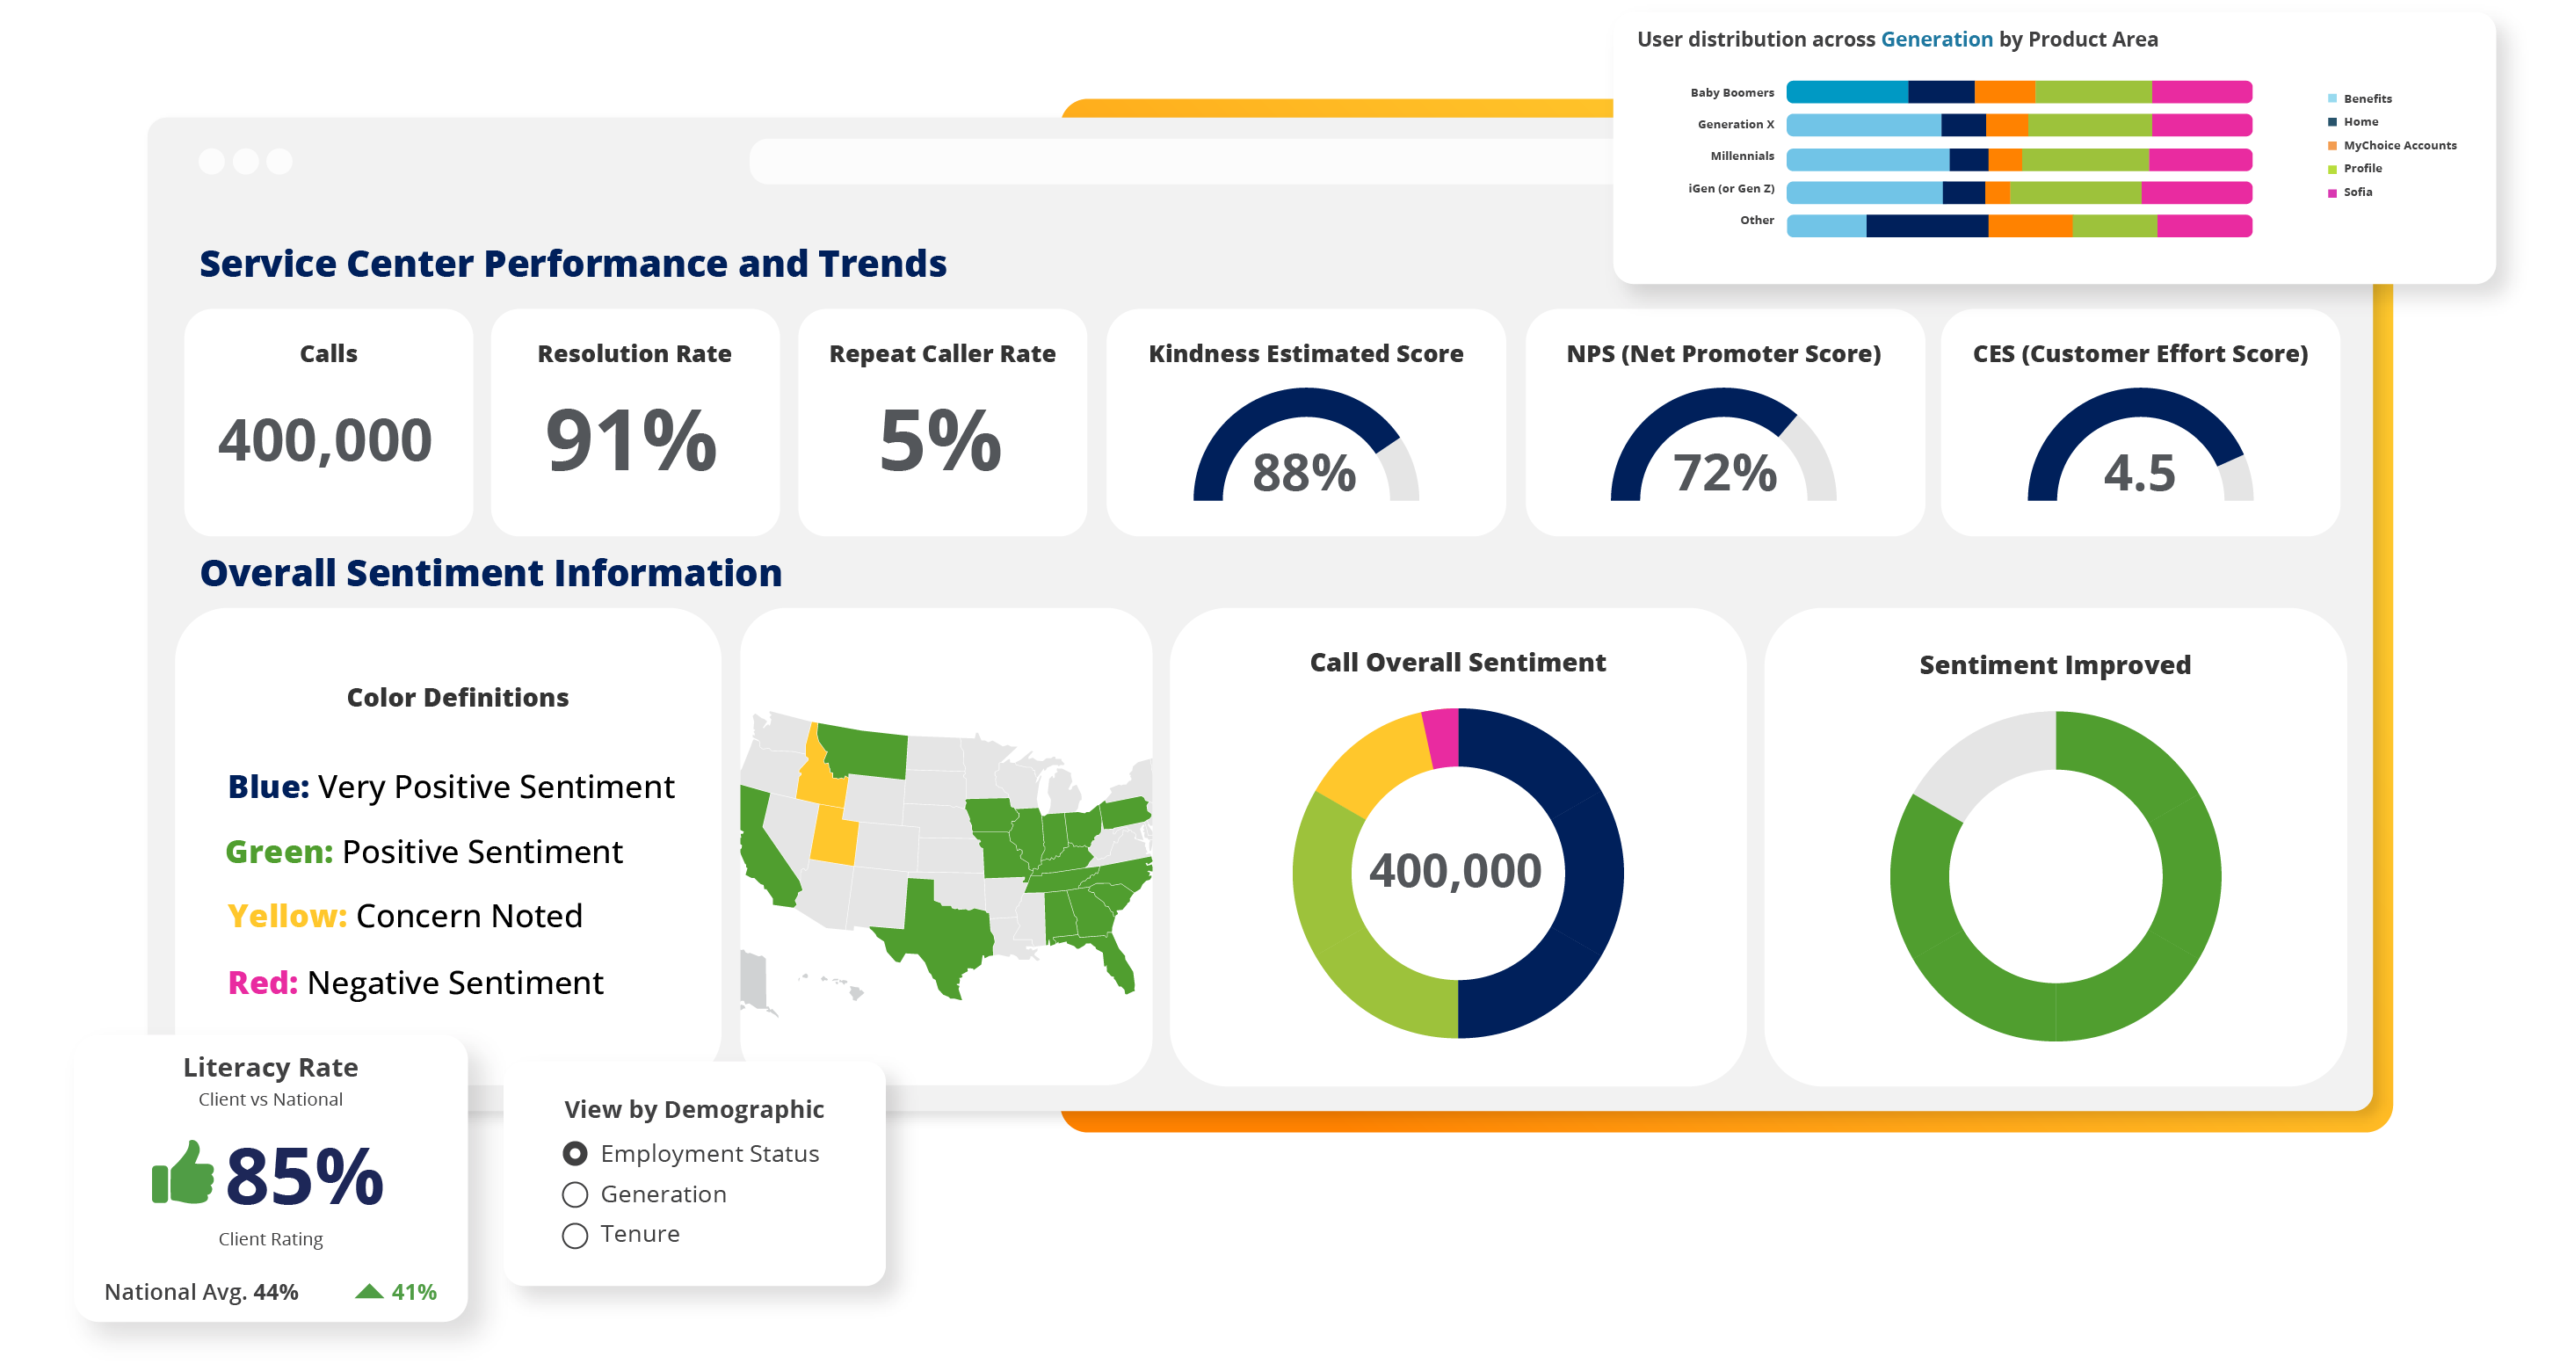
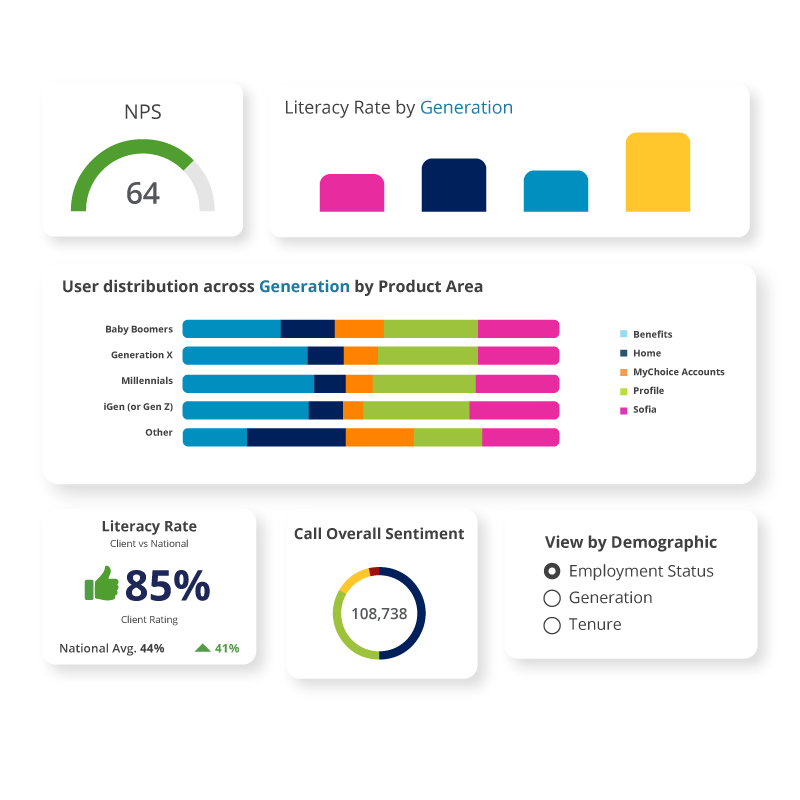
Get full access to your benefits data in one place with real-time dashboards, clear reporting, and the transparency to understand what’s happening and what to do next.
dashboard view

M+

Benefits Benchmarks completed

%

higher engagement through web, mobile, and communication channels

%

full access to your benefits data—no restricted views

Built for organizations that need clear, accurate benefits insight:

  • HR and benefits leaders responsible for reporting and strategy
  • Benefits teams analyzing engagement, utilization, and costs
  • Organizations managing complex benefits programs and populations
  • Teams looking for full data transparency—not limited reporting access
woman smiling

You can’t act on data you can’t see

Most benefits platforms limit access to data - providing static reports, delayed insights, or only partial visibility. That makes it difficult to understand what’s actually happening across your benefits programs.
Even when data is available, it’s often difficult to connect activity to outcomes, making it harder to understand what’s working and what needs to change.
Without full transparency, teams spend time pulling data together, questioning accuracy, and reacting too late to improve outcomes.

A fully transparent benefits analytics solution

A reporting and analytics solution that brings all your benefits data into one system, with real-time dashboards and direct access to the information behind them.
Instead of relying on pre-built reports alone, you can explore, analyze, and use your data, so you have a complete view of performance across your programs.
It also connects engagement, behavior, and outcomes so you can understand not just what is happening, but why it’s happening and what to do next.
guy smiling

Transform data into insight with real-time visibility, transparent reporting, and actionable trends in one powerful view

Full transparency

Access all your benefits data without limitations or restricted views

Actionable insight

Connect engagement and behavior to measurable outcomes

Informed decisions

Improve decision-making with real-time visibility into performance

Gap detection

Identify gaps and prioritize action with confidence

From benefits data to better decisions

1
Centralize your data
Bring enrollment, engagement, and usage data into one platform
2
Explore in real time
Access dashboards that update continuously
3
Analyze without barriers
Drill into the data behind every report
4
Take action with confidence
Use insights to improve programs and outcomes

Built for visibility, insight, and action

data icon
Transparent data access
  • Full access to underlying benefits data
  • No restricted views or limited reporting layers
continuous icon
Always-on dashboards
  • Real-time visibility. No waiting for static reports
  • Continuous insight into engagement, usage, and performance
Reporting icon
Self-service reporting
  • Explore, filter, and analyze data without extra tools
  • Create insights without relying on manual data pulls
web icon
Connected platform data
  • Aligns reporting with enrollment, communication, and usage
  • Ensures consistency across all data sources
data icon
Comparative and benchmark insights
  • Compare performance across programs and peer groups
  • Understand what’s working—and where to improve

Because your data shouldn't be hidden behind reports

dashboard view

Built on transparency—not limited reporting

  • Full access to your data, not just pre-built reports
  • Always-on insight, not static or delayed reporting
  • Connects data, behavior, and outcomes in one system
  • Designed to guide decisions, not just display metrics

FAQ 

Benefits reporting and analytics provides employers with access to real-time dashboards, reporting tools, and actionable insights across their benefits programs.

Businessolver helps organizations analyze benefits data across employee populations, plans, and engagement activities, giving HR and benefits teams greater visibility into enrollment, utilization, participation, and overall program performance. This enables more informed decision-making and a deeper understanding of employee benefits trends.

Many benefits platforms rely primarily on static or pre-built reports that provide limited visibility into underlying data.

Businessolver offers greater transparency and flexibility, allowing HR and benefits teams to explore, analyze, and understand benefits data using interactive dashboards and self-service reporting tools.

This helps organizations move beyond reporting to identify trends, evaluate program effectiveness, and make data-driven benefits decisions.

No. Businessolver's reporting and analytics tools are designed for HR and benefits professionals, not data analysts.

Interactive dashboards and reporting features are built to be intuitive, accessible, and easy to navigate, helping teams quickly find insights without requiring advanced technical skills or specialized training.

Organizations can access data across multiple aspects of the benefits experience, including:

  • Benefits enrollment data
  • Employee engagement metrics
  • Benefits utilization trends
  • Program participation rates
  • Communication performance metrics
  • Account and plan activity
  • Population-level benefits insights
  • Benefits program performance measures

Bringing this information together in one place helps organizations better understand how employees engage with their benefits and where opportunities for improvement may exist.

Benefits reporting and analytics helps organizations make more informed decisions by turning benefits data into actionable insights. By identifying patterns in enrollment, engagement, and utilization, HR and benefits teams can:

  • Evaluate program effectiveness
  • Identify underutilized benefits
  • Improve benefits communication strategies
  • Support workforce planning initiatives
  • Measure employee engagement with benefits
  • Optimize benefits investments

This helps organizations better align benefits programs with employee needs and business goals.

Yes. Reporting and analytics can help organizations understand how employees interact with their benefits programs throughout the year. Common engagement metrics may include:

  • Enrollment activity
  • Benefits participation rates
  • Communication engagement
  • Employee actions and interactions
  • Program utilization trends
  • Adoption of benefits resources and tools

These insights help employers measure engagement and identify opportunities to improve the employee benefits experience.

HR teams can use benefits data to identify participation trends, evaluate communication effectiveness, understand employee needs, and uncover opportunities to improve the benefits experience. By analyzing enrollment, utilization, and engagement metrics, organizations can make more informed decisions that support both employees and business objectives.
Related resources

Businessolver Benefits Insights Dashboard

Benefits Insights Dashboard

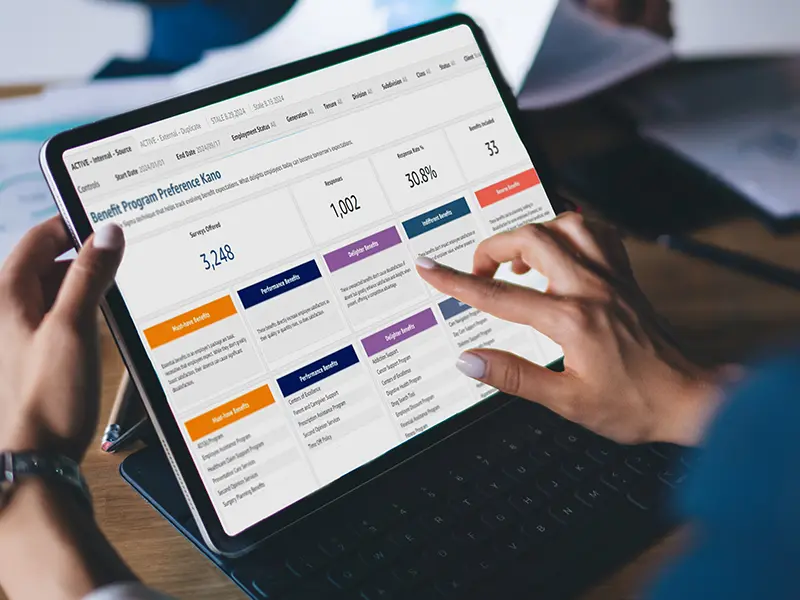
With the Benefits Insights Dashboard, which is fully integrated within Benefitsolver, you can dive into a wealth of data that you’ve never had access to before.
Read more
Resource img RFP BIR 26 scaled

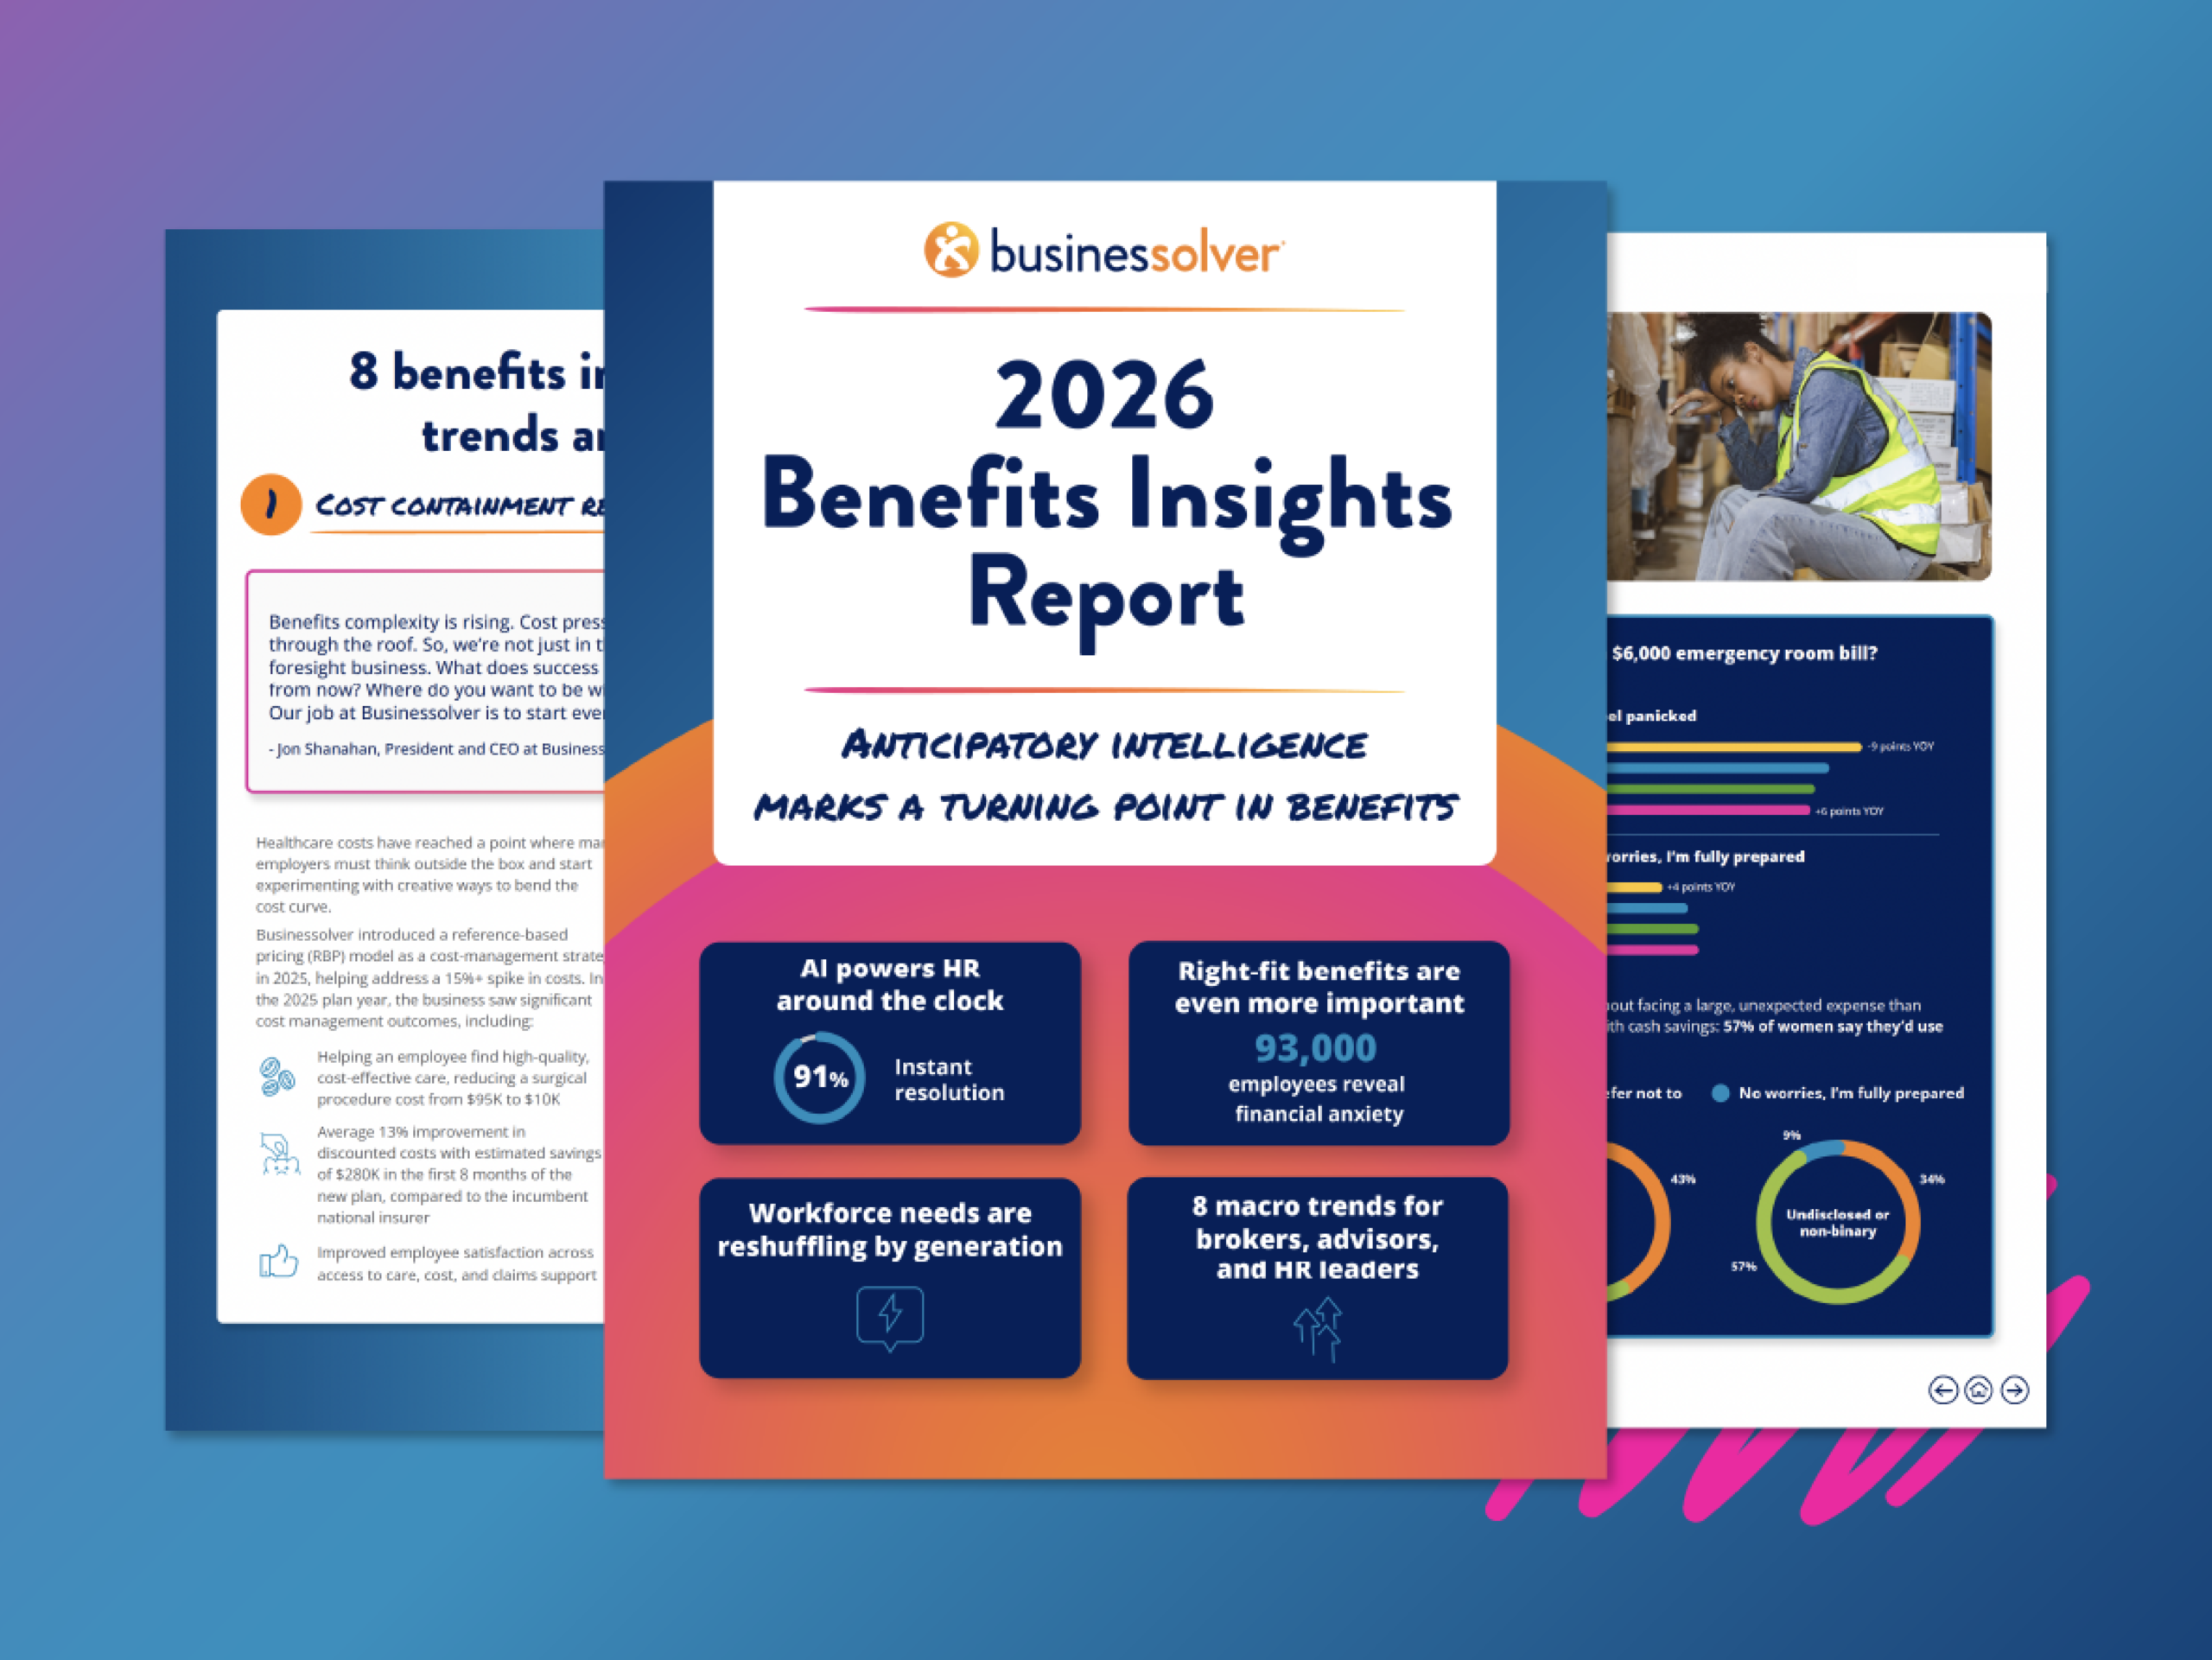
2026 Benefits Insights Report

This year's report reveals growing financial vulnerability across today’s workforce and highlights how anticipatory insights—realtime signals across engagement, service, and behavior—can help HR leaders shift from reactive benefits administration to proactive risk and cost management.
Read more
woman working on laptop

Billing and Financial Reporting Services

Discover Businessolver's billing and reporting services: Integral to our suite, ensuring seamless management and accuracy. Simplify your benefits administration effortlessly.
Read more

See everything. Act with confidence.

Get full visibility into your benefits data—so you can make decisions based on what’s actually happening.